Adding logging and tracing to an Axum App | Rust.

I am a backend developer from Venezuela. I enjoy writing tutorials for open source projects I using and find interesting. Mostly I write tutorials about Python, Go, and Rust.
DISCLAIMER: This is not a comprehensive article about logging or tracing.
The service we will build is really simple, with an endpoint and with examples showing logs in our command line, JSON logs, tracing, and how to generate log files.
For this task, we will use Tracing, tracing-subscriber, and tower-http packages.
cargo.toml
[dependencies]
axum = "0.6.1"
tokio = { version = "1.21.2", features = ["full"] }
tracing = "0.1.37"
tracing-subscriber = { version = "0.3.16", features = ["env-filter"]}
tower-http = { version = "0.3.4", features = ["trace"] }
Logs
Here is a simple example of how to add logging.
main.rs
use axum:: {
    routing::{get},
    http::StatusCode,
    Router
};

use std::net::SocketAddr;
use tower_http::trace::{self, TraceLayer};
use tracing::Level;


#[tokio::main]
async fn main() {

    tracing_subscriber::fmt()
        .with_target(false)
        .compact()
        .init();

 let app = Router::new()
        .route("/", get(hello_world))
        .layer(
            TraceLayer::new_for_http()
                .make_span_with(trace::DefaultMakeSpan::new()
                    .level(Level::INFO))
                .on_response(trace::DefaultOnResponse::new()
                    .level(Level::INFO)),

);

    let addr = SocketAddr::from(([127, 0, 0, 1], 3000));
    tracing::info!("listening on {}", addr);

    axum::Server::bind(&addr)
        .serve(app.into_make_service())
        .await
        .unwrap();
}


async fn hello_world() -> &'static str {
    "Hello World!"
}
According to the documentation, when we use compact() the output is optimized for short line lengths. Fields from the current span context are appended to the fields of the formatted event.
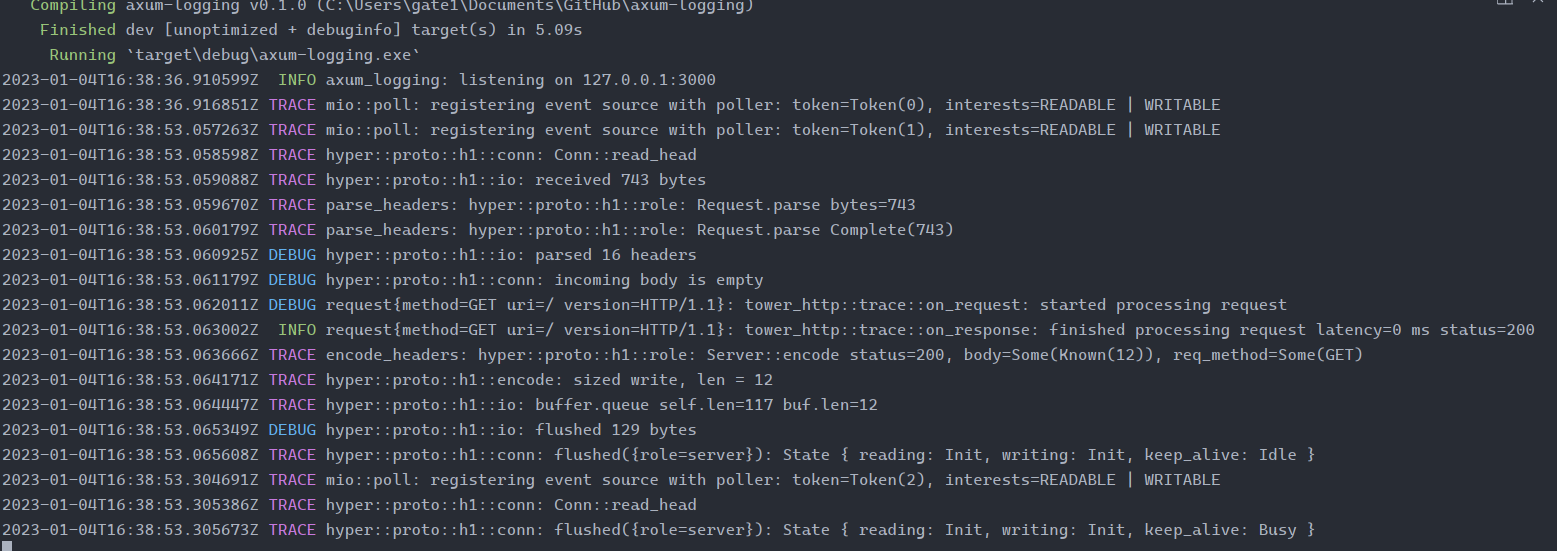
If we execute cargo run , and go to locahost:3000, we should see the following message in our terminal.

Now, let me explain a little about the role of Tower-http, Tracing, and Tracing-subscriber.
Tracing
Tracing is a framework for instrumenting Rust programs to collect structured, event-based diagnostic information.
We can use tracing to:
Emit distributed traces to an Open Telemetry collector.
Debug your application with Tokio Console.
Log to
stdout, a log file orjournald.Profile where your application is spending time.
According to the article Getting started with Tracing, the tracing crate provides the API we will use to emit traces. The tracing-subscriber crate provides some basic utilities for forwarding those traces to external listeners(e.g., stdout).
Also, the same article mentions that subscribers are types that process traces emitted by an application and its dependencies, and can perform metrics, monitoring for errors, and re-emitting traces to the outside world.
In our case, the tracing crate collects the events of our application, but we want to emit the traces and logs to our terminal, that is a task for the tracing-subscriber crate.
Tower-http
According to its documentation, tower-http is a library that provides HTTP-specific middleware and utilities built on top of tower.
The documentation also mentions that all middleware uses the http and http-body crates as the HTTP abstractions. That means they are compatible with any library or framework that also uses those crates, such as hyper, tonic, and warp.
Axum is built with hyper, so we can use tower-http .
This library aims to provide a rich set of middleware for solving common problems when building HTTP clients and servers, like adding high-level tracing and logging to our applications. Also, automatically compress or decompress response bodies and automatically follow redirection responses.
For information about tower-http, in its documentation and this article.
Now, coming back to our code.
let app = Router::new()
        .route("/", get(hello_world))
        .layer(
            TraceLayer::new_for_http()
                .make_span_with(trace::DefaultMakeSpan::new()
                    .level(Level::INFO))
                .on_response(trace::DefaultOnResponse::new()
                    .level(Level::INFO)),

);
Here, we create an instance of a Router. And use the layer method, which applies a tower::Layer to all routes in the router. It is used to add middleware to the routes.
We passed TraceLayer as an argument. Quoting the official documentation:
Layerthat adds high level tracing to aService.
The "service" the quote is referring to is a tower service. Also, we use new_for_http() , it creates a new TraceLayer using ServerErrorsAsFailures which supports classifying regular HTTP responses based on the status code, according to the documentation.
To make this work, we have to convert our router instance to a tower service. And we did it when we used into_make_service().
 axum::Server::bind(&addr)
        .serve(app.into_make_service())
        .await
        .unwrap();
Now we explain what make_span_with() and on_response() do.
The documentation says that on_response() customizes what to do when a response has been produced. And make_span_with() customizes how to make Spans that all request handling will be wrapped in.
To these functions, we passed them the log level we want. Using the level method in both, DefaulMakeSpan and DefaultOnResponse, we set the level to LEVEL::INFO. The default is LEVEL::DEBUG.
For more details about DefaultMakeSpan and DefaultOnResponse, here and here respectively.
Pretty
#[tokio::main]
async fn main() {

    tracing_subscriber::fmt()
       .with_target(false)
       .pretty()
       .init();


    let app = Router::new()
        .route("/", get(hello_world))
        .layer(
            TraceLayer::new_for_http()
                .make_span_with(trace::DefaultMakeSpan::new().level(Level::INFO))
                .on_response(trace::DefaultOnResponse::new().level(Level::INFO)),
                );

    let addr = SocketAddr::from(([127, 0, 0, 1], 3000));
    tracing::info!("listening on {}", addr);

    axum::Server::bind(&addr)
        .serve(app.into_make_service())
        .await
        .unwrap();
}
Pretty emits excessively pretty, multi-line logs, optimized for human readability, according to its documentation. Is intended to be used in local development and debugging, or for command-line applications, where readability and visual appeal are a priority.

Json
To add JSON output, we have to modify our Cargo.toml file and add the feature json to tracing_subscriber.
cargo.toml
...
tracing-subscriber = { version = "0.3.16", features = ["env-filter", "json"]}
...
#[tokio::main]
async fn main() {

    tracing_subscriber::fmt()
       .with_target(false)
       .json()
       .init();


    let app = Router::new()
        .route("/", get(hello_world))
        .layer(
            TraceLayer::new_for_http()
                .make_span_with(trace::DefaultMakeSpan::new().level(Level::INFO))
                .on_response(trace::DefaultOnResponse::new().level(Level::INFO)),
                );

    let addr = SocketAddr::from(([127, 0, 0, 1], 3000));
    tracing::info!("listening on {}", addr);

    axum::Server::bind(&addr)
        .serve(app.into_make_service())
        .await
        .unwrap();
}
Json outputs newline-delimited JSON logs. Is intended for production use with systems where structured logs are consumed as JSON by analysis and viewing tools.

Registry
...

use tracing_subscriber::{layer::SubscriberExt, util::SubscriberInitExt};

#[tokio::main]
async fn main() {

    tracing_subscriber::registry()
        .with(tracing_subscriber::fmt::layer())
        .init();


    let app = Router::new()
        .route("/", get(hello_world))
        .layer(
            TraceLayer::new_for_http()
                .make_span_with(trace::DefaultMakeSpan::new().level(Level::INFO))
                .on_response(trace::DefaultOnResponse::new().level(Level::INFO)),
                );

    let addr = SocketAddr::from(([127, 0, 0, 1], 3000));
    tracing::info!("listening on {}", addr);

    axum::Server::bind(&addr)
        .serve(app.into_make_service())
        .await
        .unwrap();
}
Quoting the documentation:
This module provides the
Registrytype, aSubscriberimplementation which tracks per-span data and exposes it toLayers. When aRegistryis used as the baseSubscriberof aLayerstack, thelayer::Contexttype will provide methods allowingLayers to look up span data stored in the registry. WhileRegistryis a reasonable default for storing spans and events, other stores that implementLookupSpanandSubscriberthemselves (withSpanDataimplemented by the per-span data they store) can be used as a drop-in replacement.
Creating log files
To create log files we have to add tracing_appender to our Cargo.toml file.
Cargo.toml
...
tracing-appender = "0.2"
use tracing::Level;
use tracing_appender::rolling;
use tracing_subscriber::fmt::writer::MakeWriterExt;
#[tokio::main]
async fn main() {
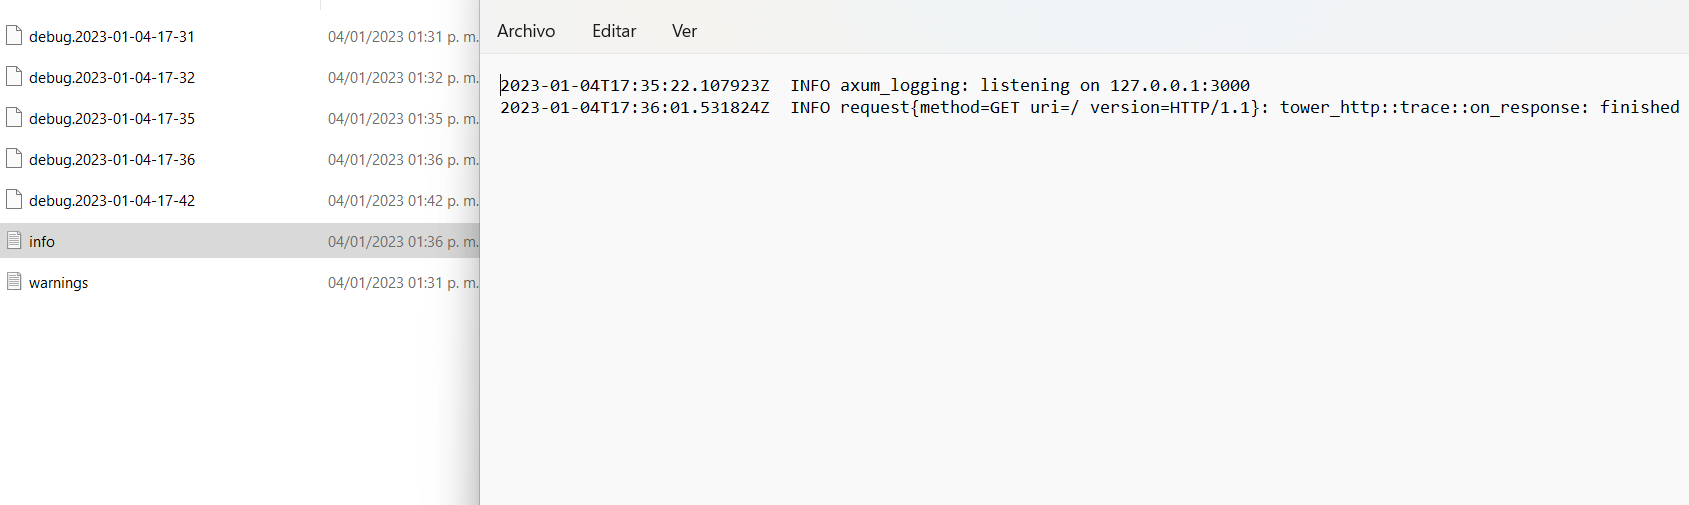
let info_file = rolling::daily("./logs", "info").with_max_level(tracing::Level::INFO);
tracing_subscriber::fmt()
.with_writer(info_file)
.with_ansi(false)
.init();
...
}
I just modified this example from the tracing repository.
Here we create a variable to define the rolling period and passed it the directory where we want our files to be stored and the name of the files. And we set the log level, in this case INFO.
Then we pass the variable info_file to with_writer() function.
with_writer() sets the MakeWriter, and it is used by fmt::Layer or fmt::Subscriber to print formatted text representations of Events.
Now, if we set the level to trace, like this.
use tracing::Level;
use tracing_appender::rolling;
use tracing_subscriber::fmt::writer::MakeWriterExt;

#[tokio::main]
async fn main() {


    let info_file = rolling::daily("./logs", "info");

    tracing_subscriber::fmt()
      .with_writer(info_file)
      .with_max_level(tracing::Level::TRACE)
      .with_ansi(false)
      .init();

  ...
}
The file will look like this.

Conclusion
Tracing offers a lot of customization. And it was a challenge for me to find what examples will be the simplest for this article. Fortunately, tracing_subscriber has good documentation and the repository has helpful examples. Also, I just use info and trace as log levels, but they are not the only ones, we can use debug, warn, error, and off.
It was fun to write this article. I did it to learn more about tracing framework and tower-http crate and how they work together.
Thank you for taking the time to read this article.
If you have any recommendations about other packages, architectures, how to improve my code, my English, or anything; please leave a comment or contact me through Twitter, or LinkedIn.
The source code is here
Reference
Getting started with Trancing.
Tracing-subscriber documentation.
tracing-appender documentation.
Issue #296: Where's the most basic example for HTTP request logging?


