Get Started with TCPdump: Capture and Analyze Network Traffic

I am a backend developer from Venezuela. I enjoy writing tutorials for open source projects I using and find interesting. Mostly I write tutorials about Python, Go, and Rust.
In this article,, we will explore what is Tcpdump and how to use some of its basic features like listing interfaces available, capturing data packets, and reading packet data files.
I recently started to learn how to use TCPdump as a part of the Google Cybersecurity course. And I thought it was a good idea to write and share what I learned, and also to have material to revisit in the future.
All the console screenshots are from a virtual machine I used in a lab that was part of the Cybersecurity course, this means that the information that is printed out probably will be different from yours. Also, many of the explanation about some features and flags of TCPdump comes from the course.
Requirements
A Linux distro installed.
WSL2 for Windows users.
What is Tcpdump?
Tcpdump is a Command-Line Interface or CLI to capture network traffic. It Tcpdump comes pre-installed in many Linux distributions and can also be installed on other Unix-based operating systems such as macOS®. Tcpdump is used to identify malicious activity in a network and to identify issues in a network. We can capture network traffic and save it to a packet capture (p-cap), a file containing data packets intercepted from an interface or network.
Identifying interfaces
In Tcpdump we use the -D flag to list all the interfaces available for packet capture.
We open a console or WSL console for Windows users, and execute the following command:
sudo tcpdump -D
After we execute the command above, the console should show the following list:

Now, we will capture the packets from the eth0 interface, but not all of them, just five packets of data.
sudo tcpdump -i eth0 -v -c5
The -i option is used to select an interface, in this case, the eth0 interface.
The -v means "Verbose" and it prints out detailed information about the packet data. And the -c option allows us to control how many packets we want tcpdump to print out.
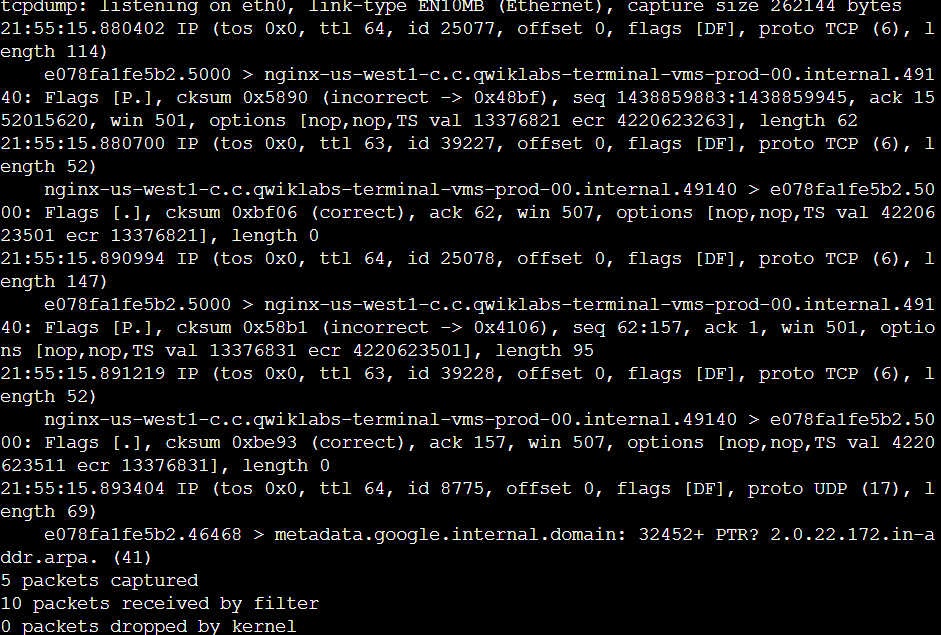
In the example data at the start of the packet output, tcpdump reported that it was listening on the eth0 interface, and it provided information on the link type and the capture size in bytes:
tcpdump: listening on eth0, link-type EN10MB (Ethernet),
capture size 262144 bytes
On the next line, the first field is the packet's timestamp, followed by the protocol type, IP:
22:24:18.910372 IP
The verbose option, -v, has provided more details about the IP packet fields, such as TOS, TTL, offset, flags, internal protocol type (in this case, TCP (6)), and the length of the outer IP packet in bytes:
(tos 0x0, ttl 64, id 5802, offset 0, flags [DF], proto TCP (6), length 134)
Now, let's see what it means in the snippet above:
The tos 0x0 represents the Type of Service (ToS) field in the IP header. In this case, 0x0 indicates the default ToS, with no specific priority or options set.
The ttl 64, time to Live (TTL) field in the IP header. It specifies how many hops (routers) a packet can traverse before being discarded. 64 is a commonly used value for local networks.
id 5802 this is the identification number of the TCP packet. It helps differentiate different packets belonging to the same TCP connection. offset 0 indicates that the data portion of the packet starts immediately after the header, with no header options present.
The flags [DF] shows the flags set in the TCP header. The [DF] flag specifically indicates that the Don't Fragment (DF) flag is set, meaning the packet should not be fragmented if it doesn't fit the Maximum Transmission Unit (MTU) of any network device along the path. proto TCP (6) specifies the transport layer protocol used, which in this case is TCP (Transmission Control Protocol). And length 134 is the total length of the TCP packet, including the header and data.
In the next section, the data shows the systems that are communicating with each other:
7acb26dc1f44.5000 > nginx-us-east1-c.c.qwiklabs-terminal-vms-prod-00.internal.59788:
By default, tcpdump will convert IP addresses into names, as in the screenshot. The name of my Linux virtual machine also included in the command prompt, appears here as the source for one packet and the destination for the second packet. In your live data, the name will be a different set of letters and numbers.
The direction of the arrow (>) indicates the direction of the traffic flow in this packet. Each system name includes a suffix with the port number (.5000 in the code snippet) which is used by the source and the destination systems for this packet.
The remaining data filters the header data for the inner TCP packet:
Flags [P.], cksum 0x5851 (incorrect > 0x30d3),
seq 1080713945:1080714027, ack 62760789,
win 501, options [nop,nop,TS val 1017464119 ecr 3001513453],
length 82
The flags field identifies TCP flags. In this case, the P represents the push flag and the period indicates it's an ACK flag. This means the packet is pushing out data.
The next field is the TCP checksum value, which is used for detecting errors in the data.
This section also includes the sequence and acknowledgment numbers, the window size, and the length of the inner TCP packet in bytes.
Capturing network traffic for further analysis
sudo tcpdump -i eth0 -nn -c9 port 80 -w capture.pcap &
This command will run tcpdump in the background with the following options:
-i eth0: Capture data from theeth0interface.-nn: Do not attempt to resolve IP addresses or ports to names. This is best practice from a security perspective, as the lookup data may not be valid. It also prevents malicious actors from being alerted to an investigation.-c9: Capture 9 packets of data and then exit.port 80: Filter only port 80 traffic. This is the default HTTP port.-w capture.pcap: Save the captured data to the named file.&: This is an instruction to the Bash shell to run the command in the background.
Now, we will use curl, to make a request and see what Tcpdump will print it out.
curl opensource.google.com
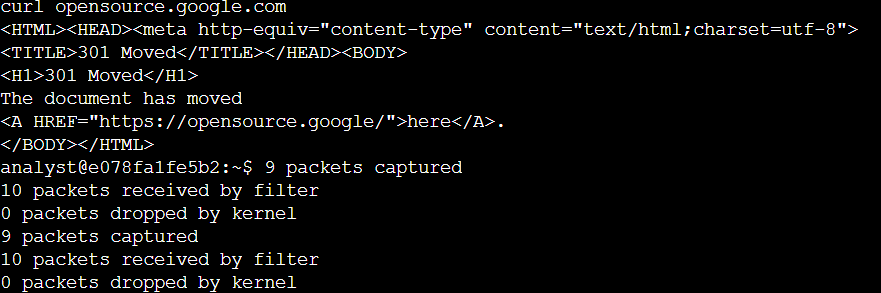
Next, we make sure that Tcpdump captures the data packets.
ls -l capture.pcap
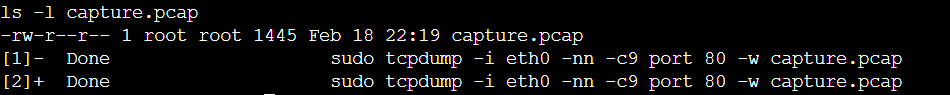
As we can see in the screenshot above, the packet capture was successful and it was written in the capture.pcap file for further analysis.
Conclusion
In this article, we just explore a little bit about Tcpdump, how to identify interfaces, print out packets data, capturing and reading packet data file. Tcpdump is an amazing tool and very useful for anyone interested in learning about networks or cybersecutiry.


