Monitoring Your Go Application with Prometheus and Grafana: A Step-by-Step Guide

I am a backend developer from Venezuela. I enjoy writing tutorials for open source projects I using and find interesting. Mostly I write tutorials about Python, Go, and Rust.
Prometheus and Grafana are open-source tools for monitoring and observability of systems. This step-by-step guide explains how to install and configure Prometheus and Grafana, add Prometheus as a data source, create a dashboard, and use them to monitor a Go application. It also provides references to additional resources for further learning.
Requirements
- Go installed
Prometheus
Prometheus is an open-source systems monitoring and alerting toolkit originally built at SoundCloud. Since its inception in 2012, many companies and organizations have adopted Prometheus, and the project has a very active developer and user community.
Grafana
Grafana is an open-source platform for monitoring and observability. It allows you to query, visualize, alert on and understand your metrics no matter where they are stored. Create, explore, and share beautiful dashboards with your team and foster a data-driven culture.
Installation
First, we have to install Prometheus and Grafana.
Prometheus
To install Prometheus, you can use a Docker Image or download a precompiled binary. We will use a precompiled binary, to download it, we have to go to this site.
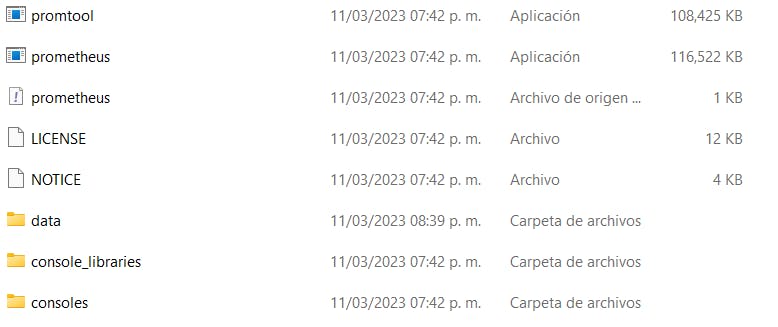
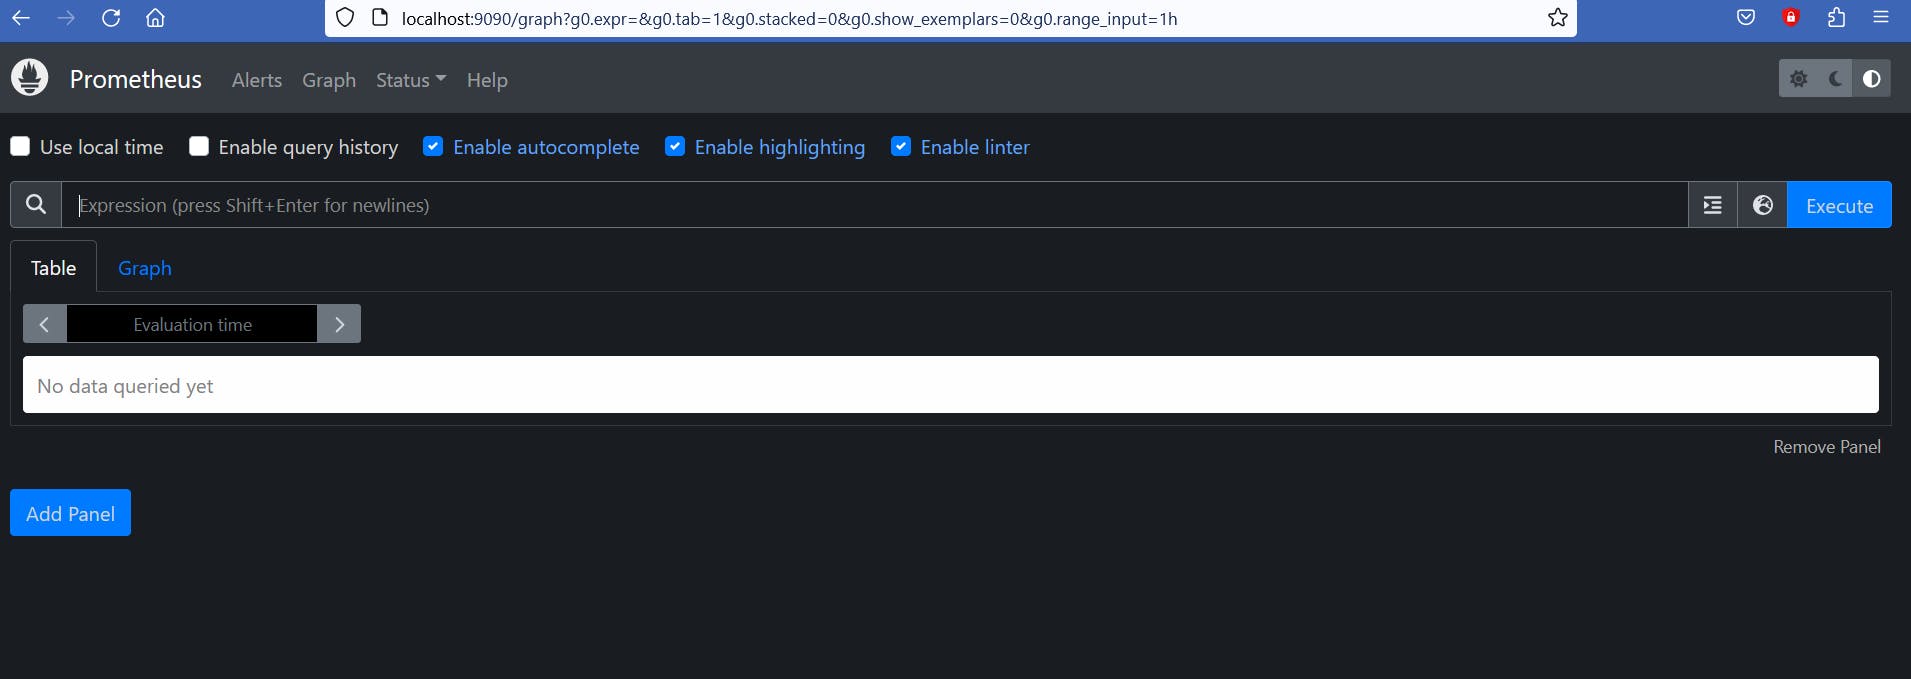
The prometheus server will start on port 9090. So we go to localhost:9090 to see its UI.
Grafana
To install Grafana we have to download the installer from this site.
In the case of Windows users, after installation, we have to go to programs file > GrafanaLabs > grafana > bin and start grafana-server.exe .

Adding Prometheus as a data source
We start the grafana-server a go to its default port: localhost:3000.

We log in using "admin" both as username and password.
We click on "Add your first data source".

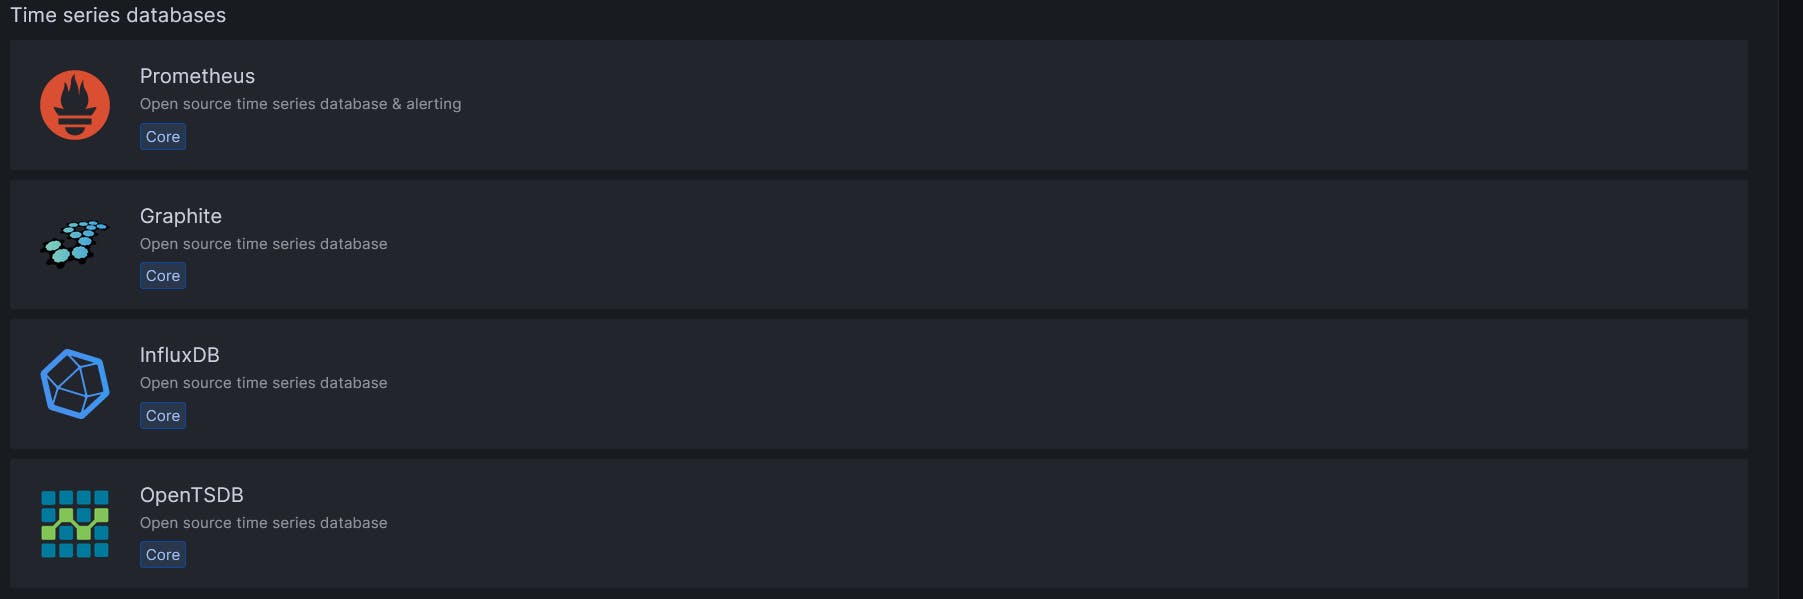
We select "Prometheus" as data source.
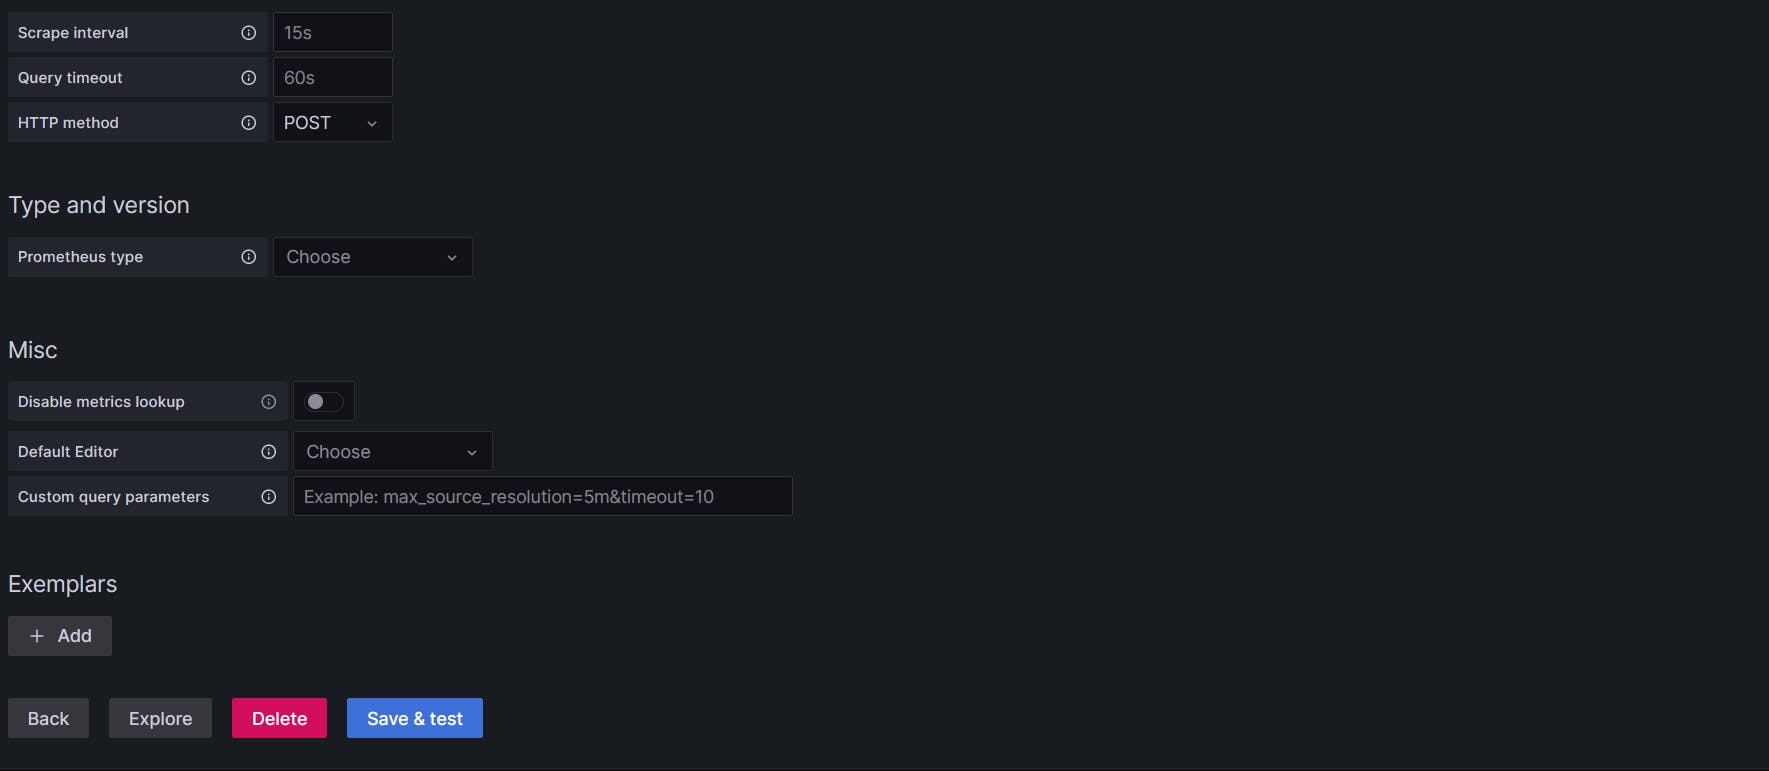
On the URL field, we write the port where the Prometheus server is running: localhost:9090.
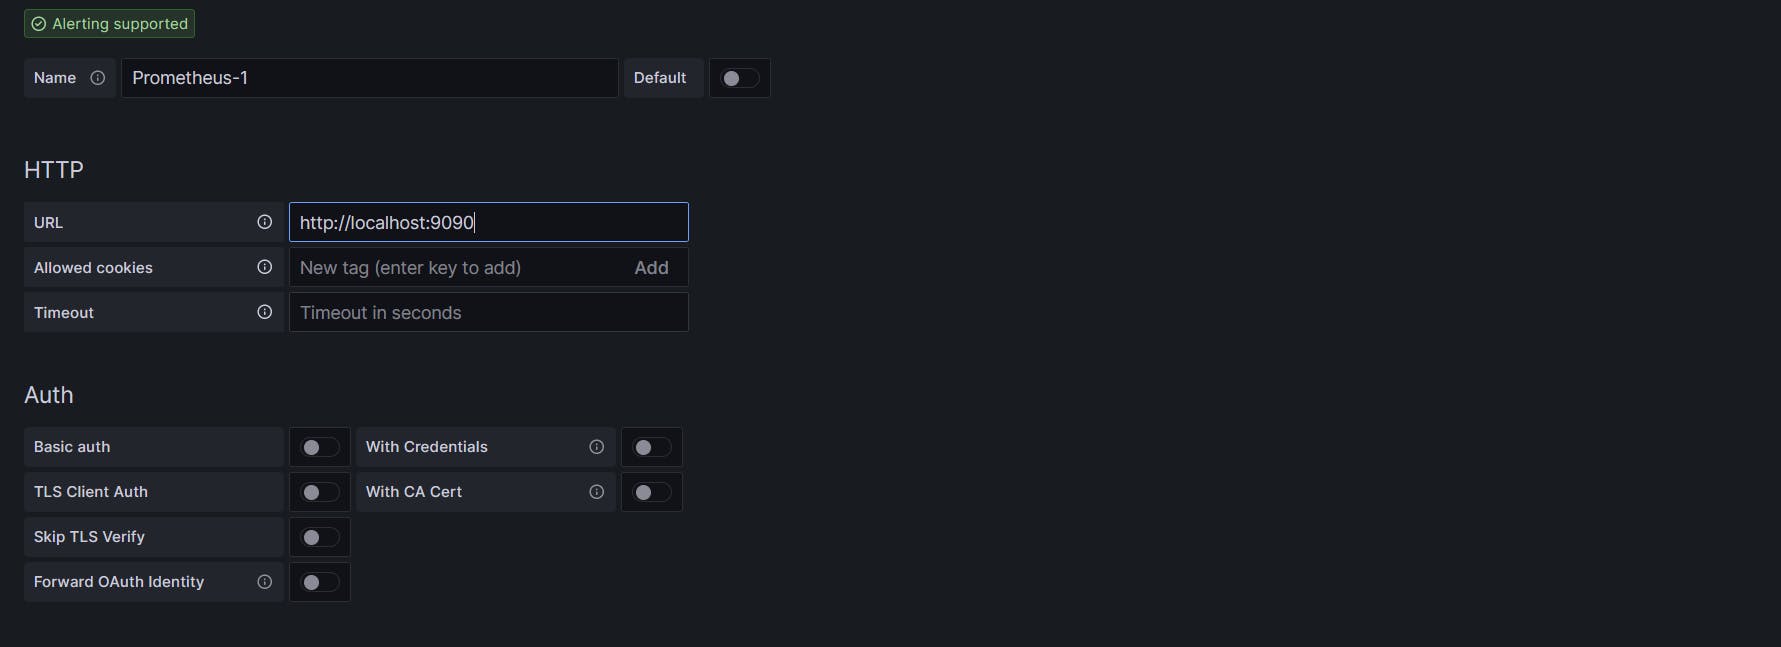
The, we click on "Save & test". Grafana will check if it can connect to the Prometheus server.
Creating a dashboard
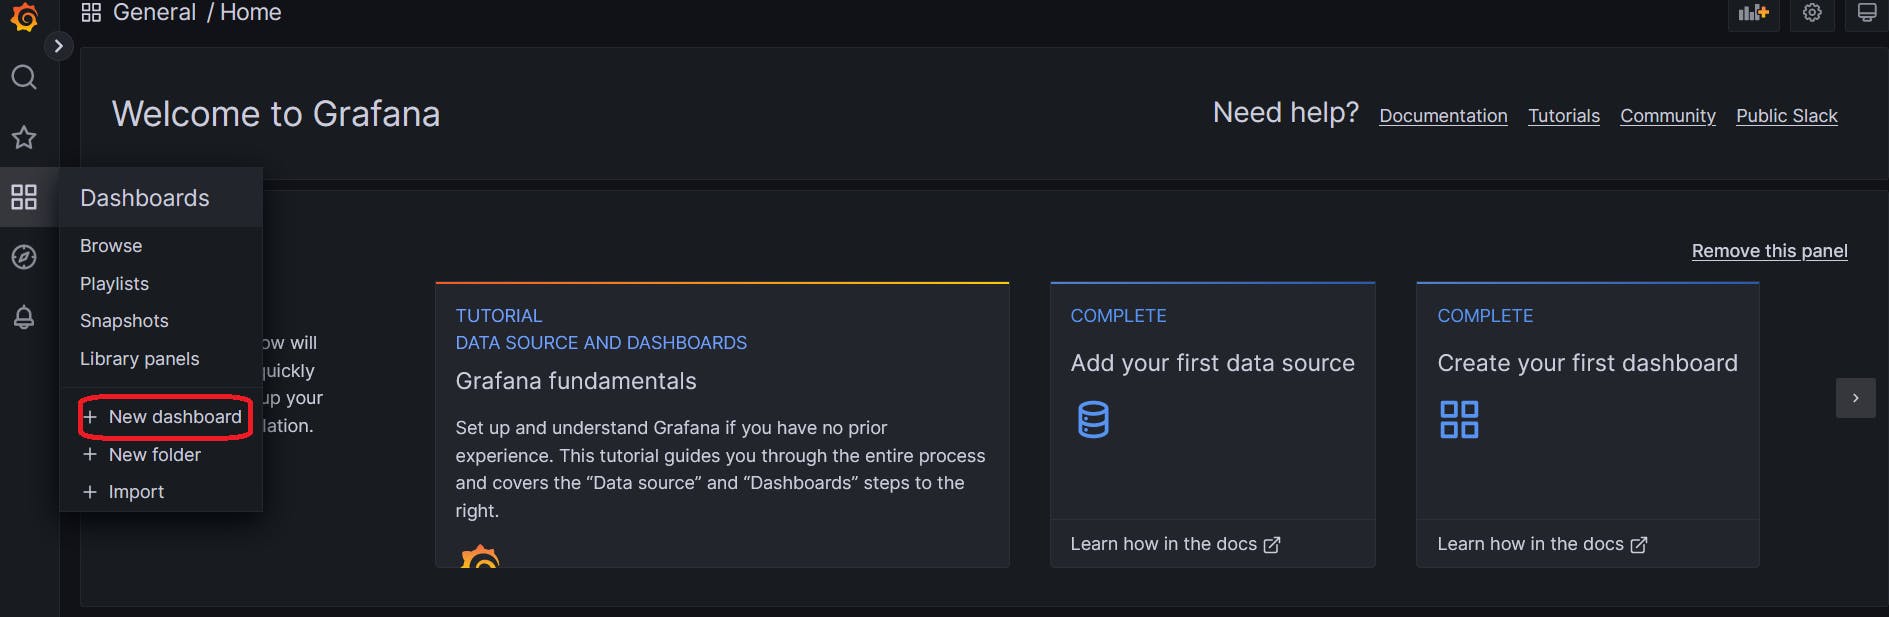
After we defined our data source, we create a dashboard by clicking on "New dashboard".
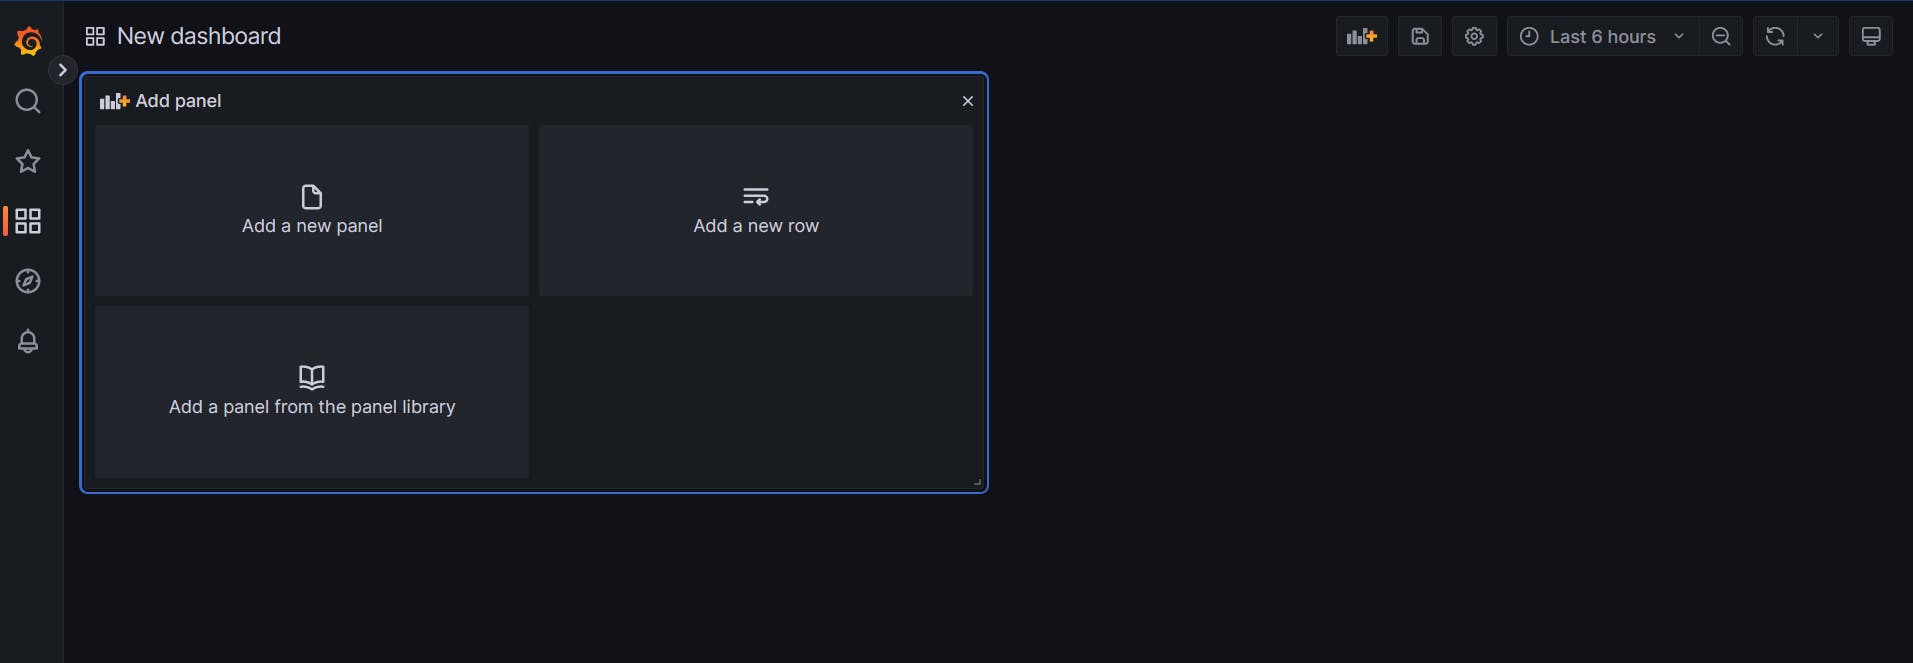
Then, we click on "Add a new panel".
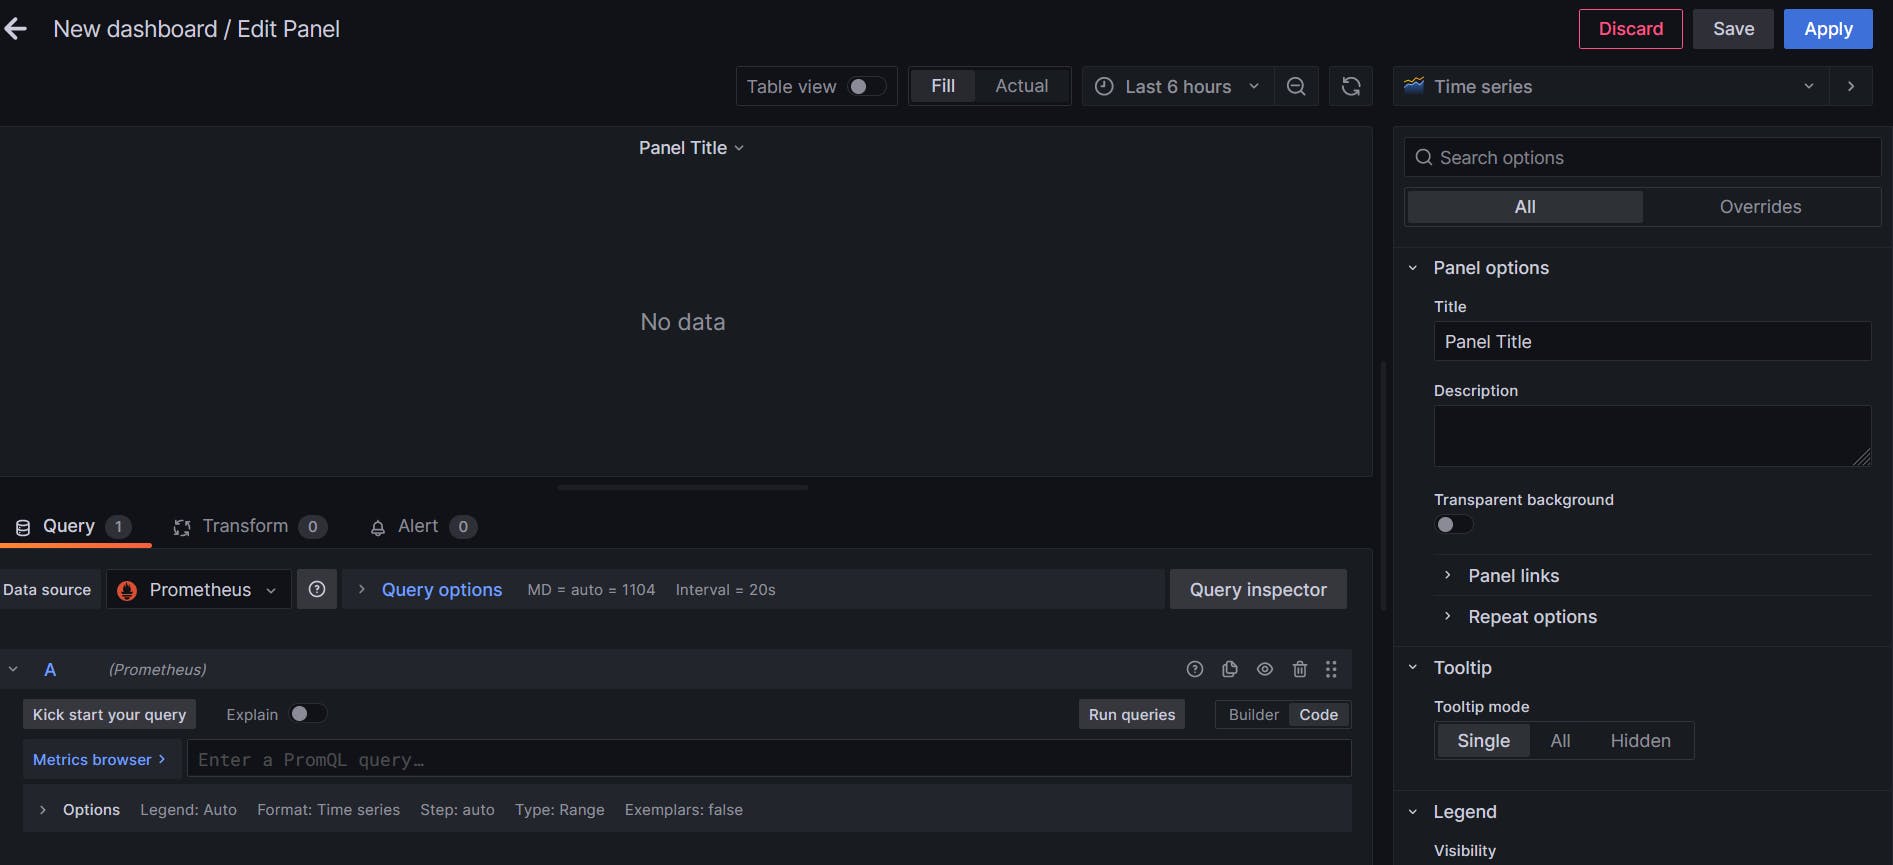
It will show "No data" because there are no queries and we have not started to collect any metrics yet.
Go server
For building the server, we will use Gin.
package main
import (
"net/http"
"github.com/gin-gonic/gin"
"github.com/prometheus/client_golang/prometheus"
"github.com/prometheus/client_golang/prometheus/promhttp"
)
func main() {
r := gin.Default()
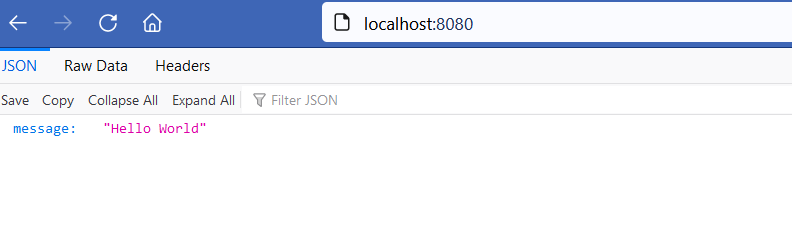
r.GET("/", func(c *gin.Context) {
c.JSON(http.StatusOK, gin.H{
"message": "Hello World",
})
})
r.Run()
}
We run the command go run main.go in our terminal. And go to localhost:8080.
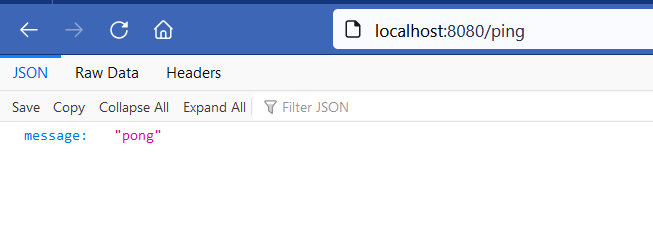
func ping(c *gin.Context) {
    c.JSON(http.StatusOK, gin.H{
        "message": "pong",
    })
}
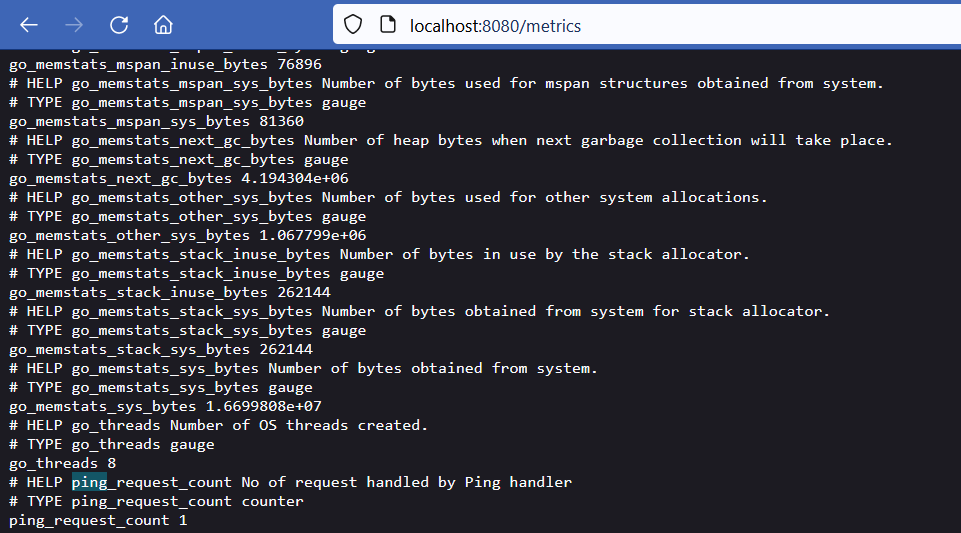
Now let's add a metric to the server which will instrument the number of requests made to the ping endpoint, the counter metric type is suitable for this as we know the request count doesn’t go down and only increases. Create a Prometheus counter
var pingCounter = prometheus.NewCounter(
    prometheus.CounterOpts{
        Name: "ping_request_count",
        Help: "No of request handled by Ping handler",
    },
)
Next, let's update the ping Handler to increase the count of the counter using pingCounter.Inc().
func ping(c *gin.Context) {
    pingCounter.Inc()
    c.JSON(http.StatusOK, gin.H{
        "message": "pong",
    })
}
func main() {
    prometheus.MustRegister(pingCounter)
    r := gin.Default()
    r.GET("/", func(c *gin.Context) {
        c.JSON(http.StatusOK, gin.H{
            "message": "Hello World",
        })
    })
    r.GET("/ping", ping)
    r.GET("/metrics", gin.WrapH(promhttp.Handler()))
    r.Run()
}
The prometheus.MustRegister function registers the pingCounter to the default Register. To expose the metrics the Go Prometheus client library provides the promhttp package. promhttp.Handler() provides an http.Handler which exposes the metrics registered in the Default Register.
To use promhttp.Handler(), we wrap it using gin.WrapH() which is a middleware function that helps to wrap an http.Handler from a third-party router or mux and convert it into a Gin middleware handler.
Complete main file
package main

import (
    "net/http"

    "github.com/gin-gonic/gin"
    "github.com/prometheus/client_golang/prometheus"
    "github.com/prometheus/client_golang/prometheus/promhttp"
)

func main() {
    prometheus.MustRegister(pingCounter)
    r := gin.Default()
    r.GET("/", func(c *gin.Context) {
        c.JSON(http.StatusOK, gin.H{
            "message": "Hello World",
        })
    })
    r.GET("/ping", ping)
    r.GET("/metrics", gin.WrapH(promhttp.Handler()))
    r.Run()
}

var pingCounter = prometheus.NewCounter(
    prometheus.CounterOpts{
        Name: "ping_request_count",
        Help: "No of request handled by Ping handler",
    },
)

func ping(c *gin.Context) {
    pingCounter.Inc()
    c.JSON(http.StatusOK, gin.H{
        "message": "pong",
    })
}
prometheus.yml
# my global config
global:
  scrape_interval: 15s # Set the scrape interval to every 15 seconds. Default is every 1 minute.
  evaluation_interval: 15s # Evaluate rules every 15 seconds. The default is every 1 minute.
  # scrape_timeout is set to the global default (10s).

# Alertmanager configuration
alerting:
  alertmanagers:
    - static_configs:
        - targets:
          # - alertmanager:9093

# Load rules once and periodically evaluate them according to the global 'evaluation_interval'.
rule_files:
  # - "first_rules.yml"
  # - "second_rules.yml"

# A scrape configuration containing exactly one endpoint to scrape:
# Here it's Prometheus itself.
scrape_configs:
  # The job name is added as a label `job=<job_name>` to any timeseries scraped from this config.
  - job_name: "prometheus"

    # metrics_path defaults to '/metrics'
    # scheme defaults to 'http'.

    static_configs:
      - targets: ["localhost:9090"]

  - job_name: gin-server
    static_configs:
      - targets: ["localhost:8080"]
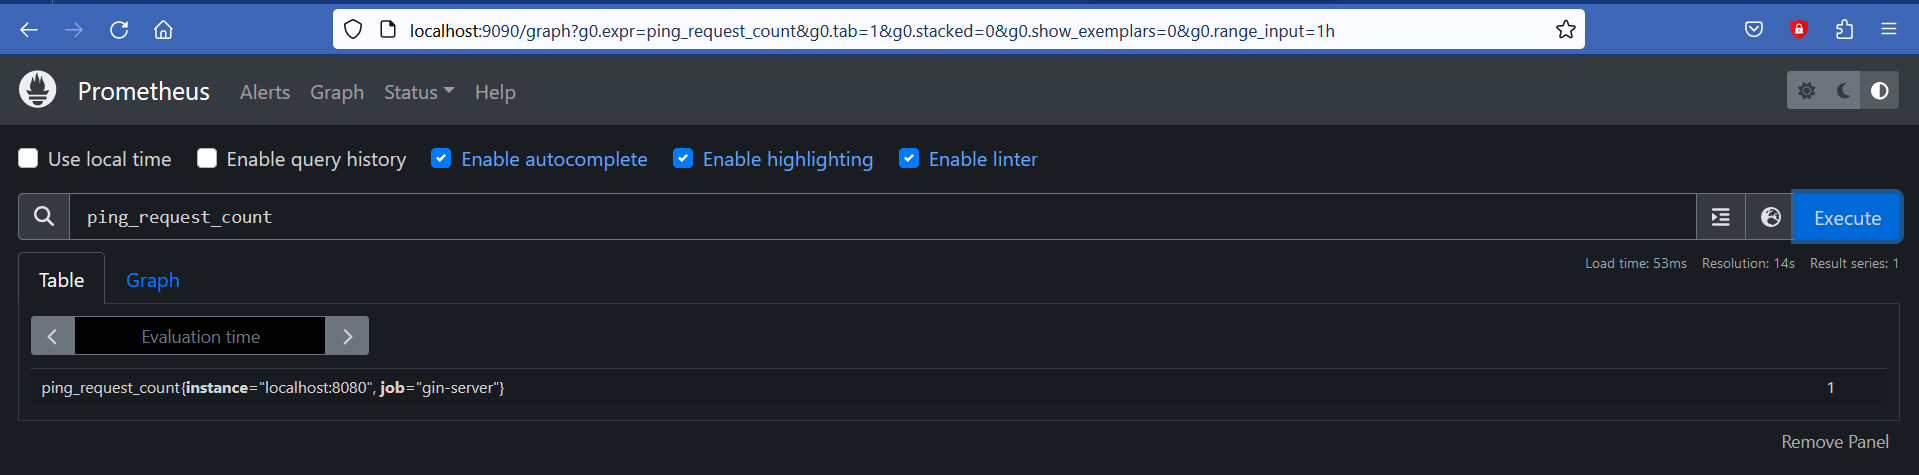
prometheus.yml is the configuration file for the Prometheus server. We add another job_name to scrape the metrics of our Gin server and define it as gin-server . We have to specify the port where the exporter is listening, in our case, 8080. Now, we can go to localhost:9090 and execute a query to test if Prometheus is collecting any metric.
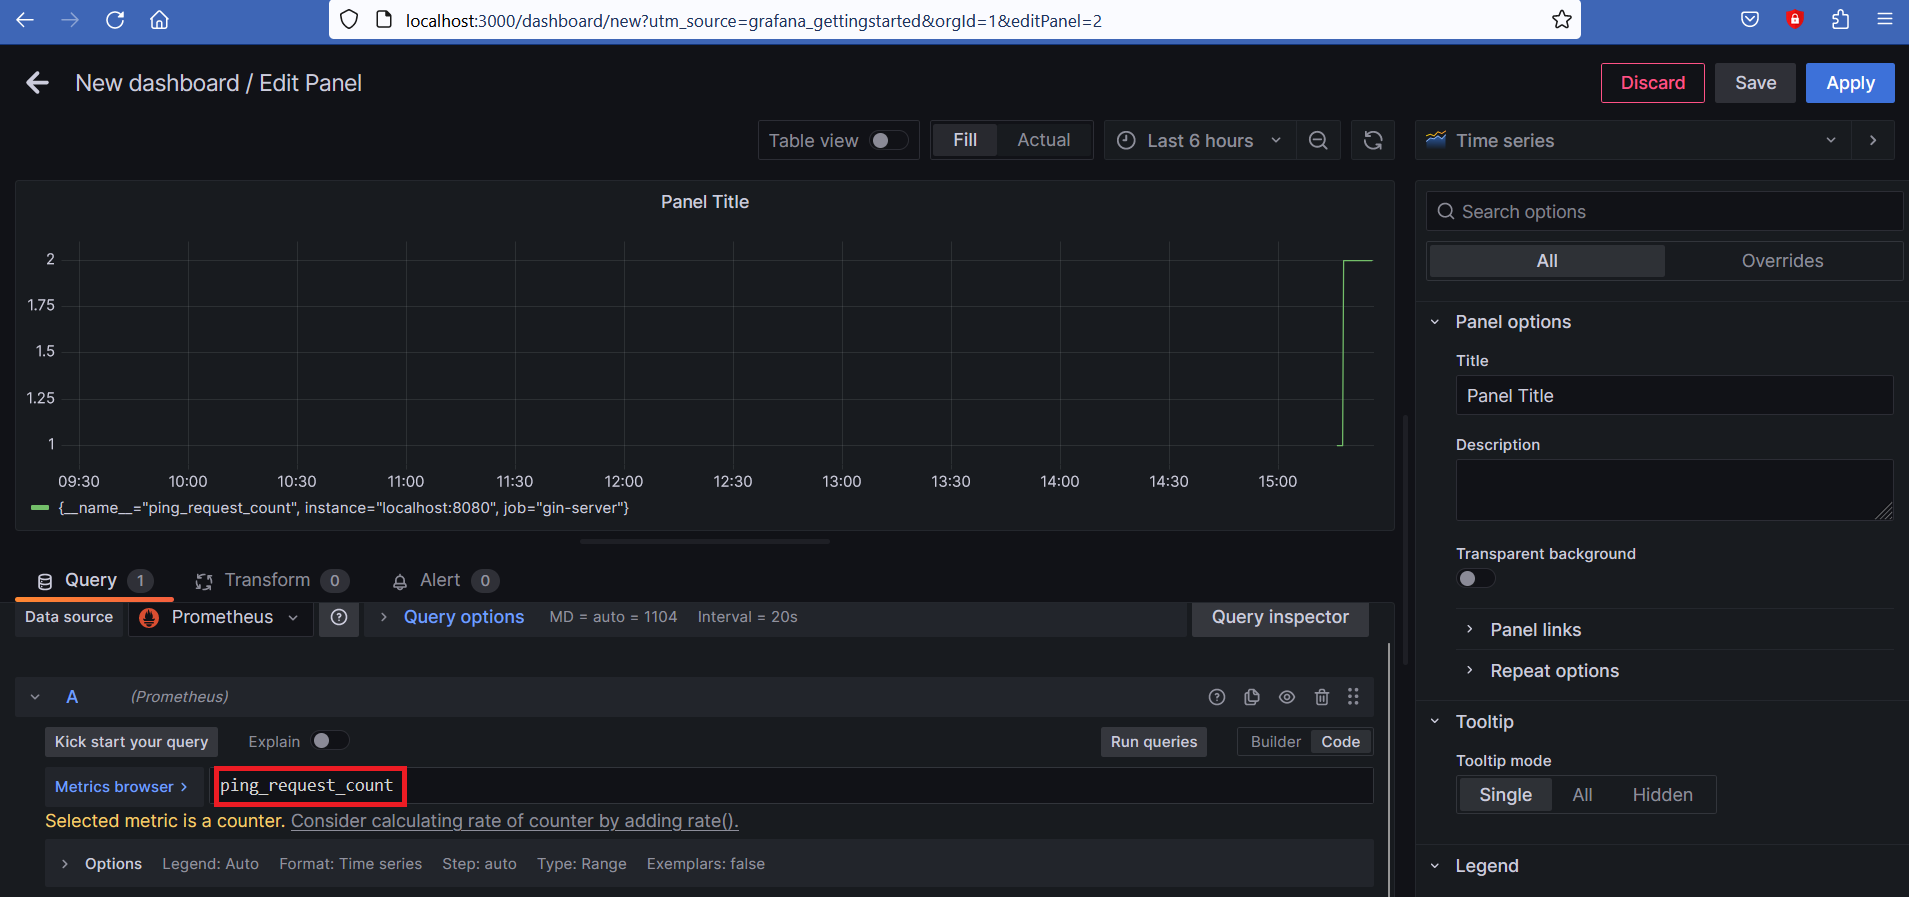
We go to the grafana server, localhost:3000, and go to our dashboard, we can run the same query: ping_request_count.
Conclusion
In conclusion, Prometheus and Grafana are powerful open-source tools for monitoring and observability of systems. They can be easily installed and configured to collect and visualize metrics from various sources. With the help of these tools, developers and organizations can gain valuable insights into the performance and health of their systems, and make data-driven decisions to improve them.
Thank you for taking the time to read this article.
If you have any recommendations about other packages, architectures, how to improve my code, my English, or anything; please leave a comment or contact me through Twitter, or LinkedIn.
The source code is here.


