Analyzing Network Traffic With Wireshark

I am a backend developer from Venezuela. I enjoy writing tutorials for open source projects I using and find interesting. Mostly I write tutorials about Python, Go, and Rust.
Previously, I published an article about analyzing network traffic with Tcpdump. In this article, we are going to analyze network traffic using Wireshark. We will learn what Wireshark is, how to install it, and how to analyze network traffic by reading a pcap file and applying filters.
The content of this article is limited by what I learned about Wireshark in the Google Cybersecurity course. So, this is not comprehensive material about Wireshark.
What is Wireshark?
According to the Wireshark official page:
Wireshark® is a network protocol analyzer. It lets you capture and interactively browse the traffic running on a computer network. It has a rich and powerful feature set and is one world’s most popular tool of its kind. It runs on most computing platforms including Windows, macOS, Linux, and UNIX.
Installing Wireshark
To install Wireshark, we visit this page and select one of the options available according to our OS.
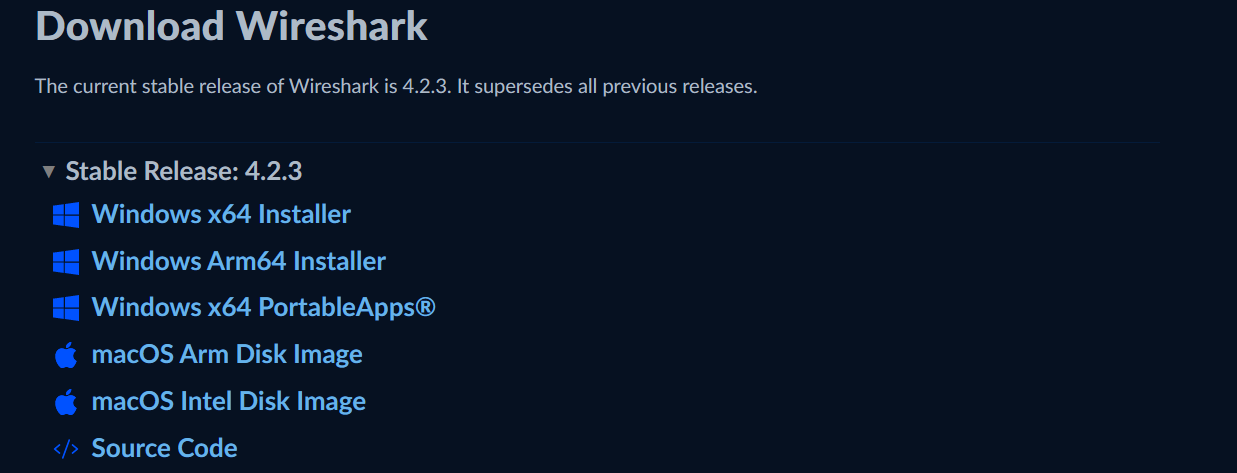
I have Windows 11, so I have to select "Windows x64 Installer".
Exploring a pcap file
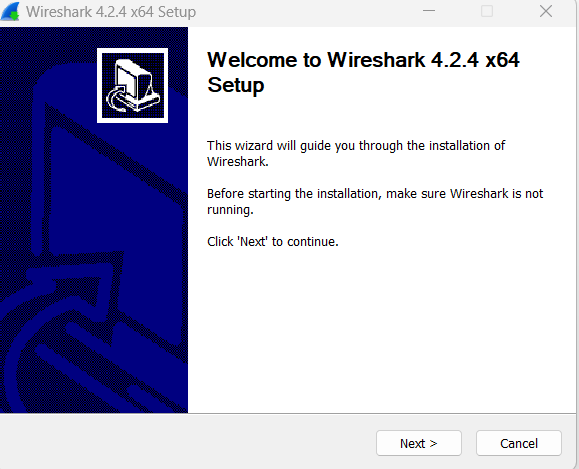
After installing Wireshark, we open the application and explore a pcap file.
We can download a sample pcap file from these websites.
I downloaded a sample from this website.
If you want to use the same files I used to follow along, these are the ones I used:
Open Network Connection.pcapng.cap
Next, we open a sample with Wireshark. I will open first the "arp_pcap.pcapng.cap" file.
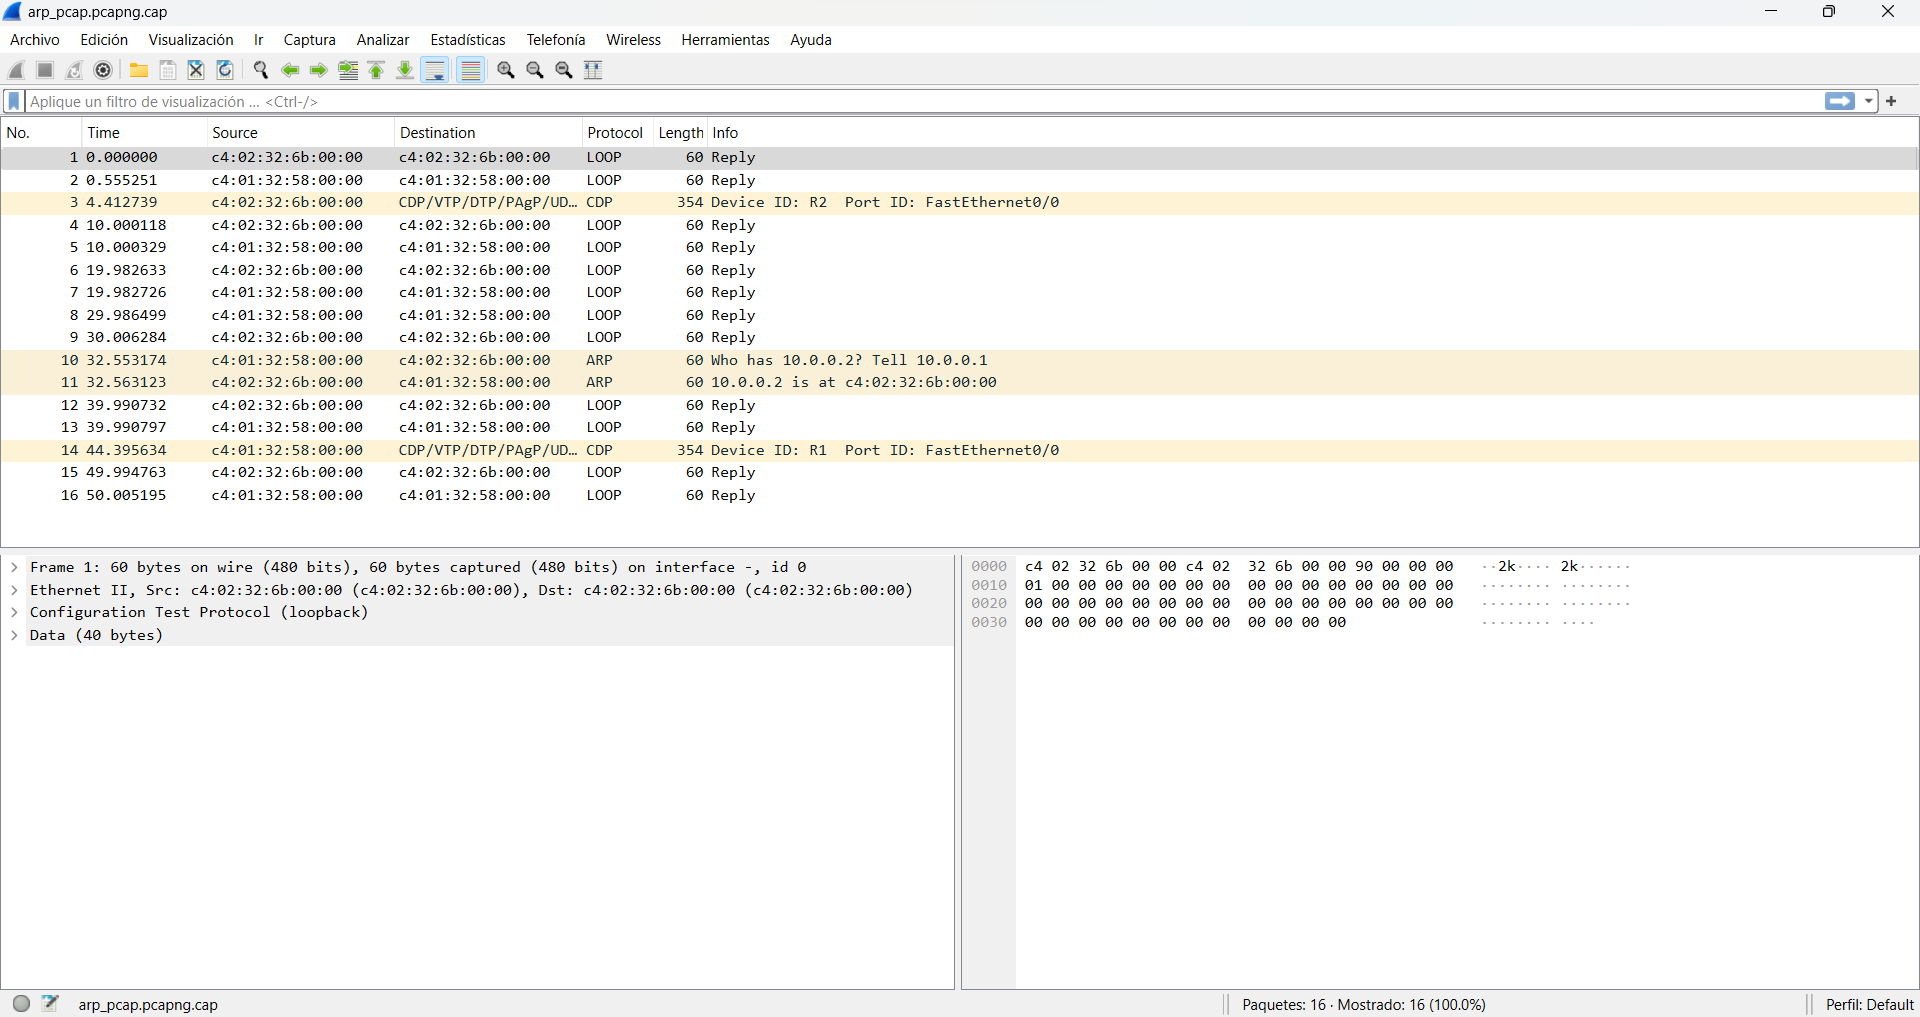
As we can see in the image above, Wireshark shows seven columns or attributes.
"No." is the index number of the packet in this packet capture file. Time is the packet's timestamp. Source is the source IP address. Destination, The destination IP address. Protocol is the protocol contained in the packet. Length is the total length of the packet. Info, some information about the data in the packet (the payload) as interpreted by Wireshark.
Using filters
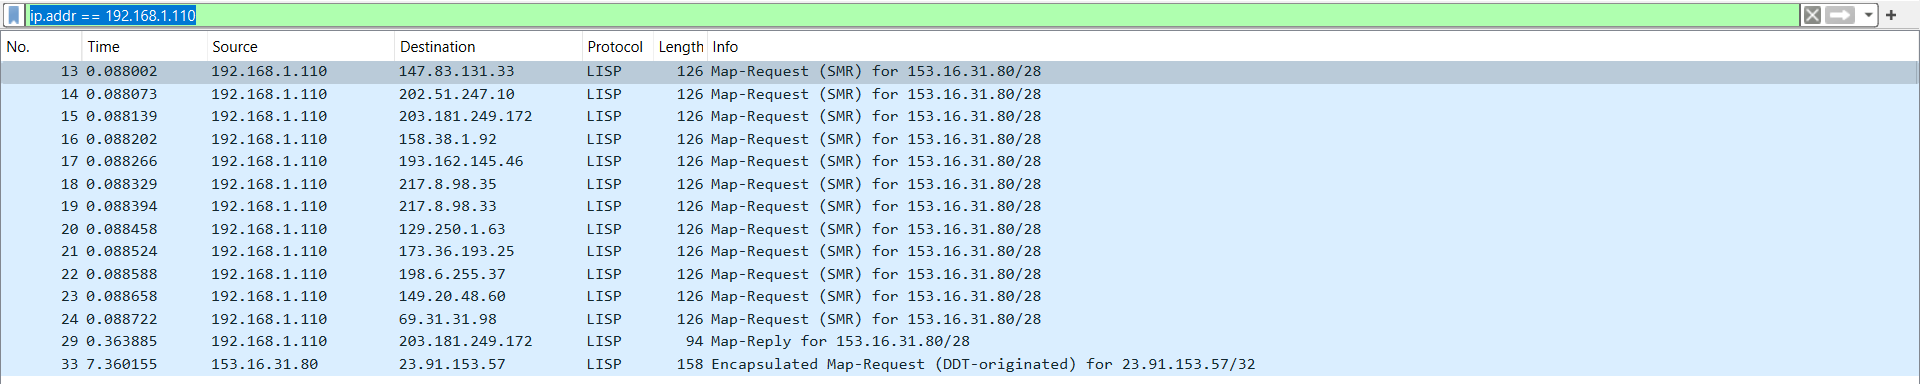
Now, we can use the search bar in Wireshark to apply filters.

I will search all the packets that contain the IP address "192.168.1.110" no matter if it is the source or destination. So, we need to write this text in the search bar.
ip.addr == 192.168.1.110
If we double-click on any packet, we can have more detailed information about it.
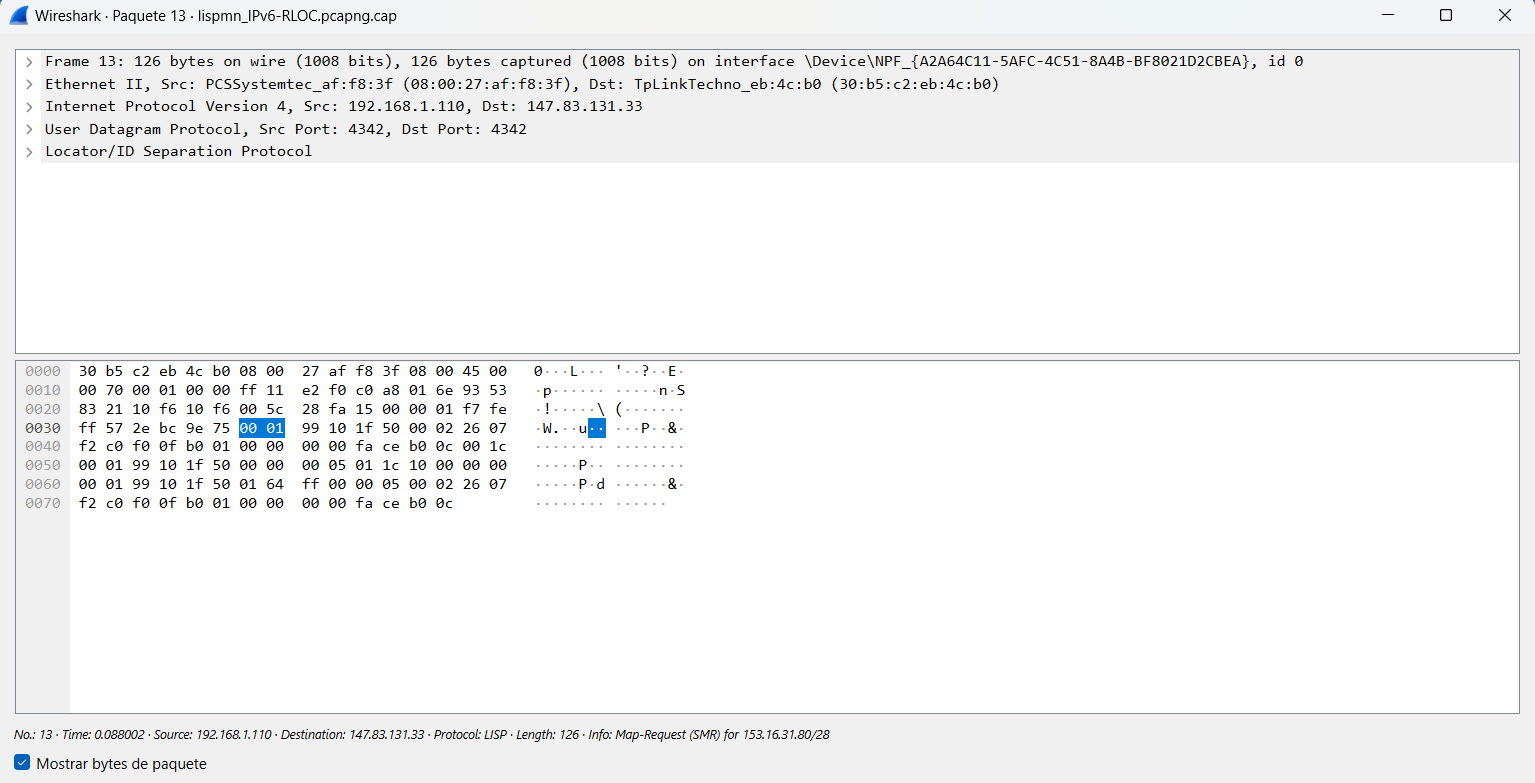
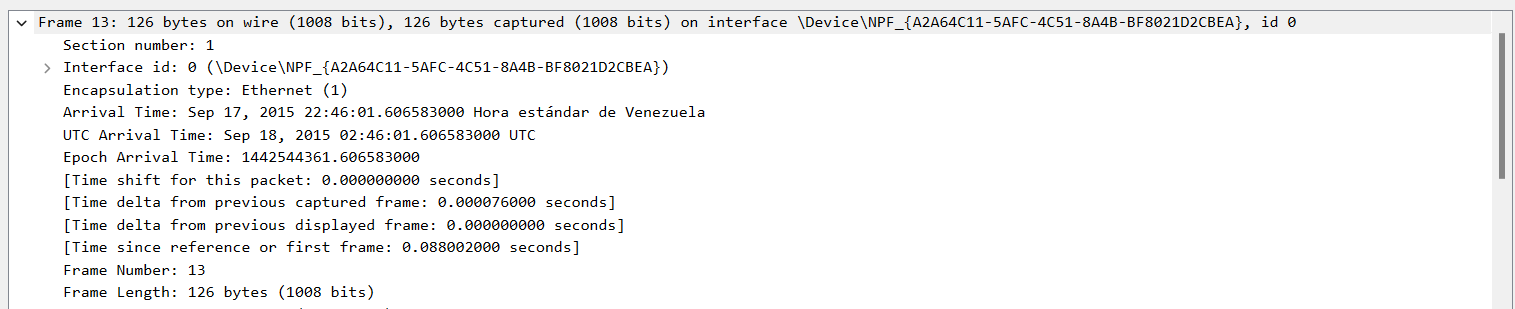
If we click on Frame, which shows details about the overall network packet, including the packet's length and arrival time.
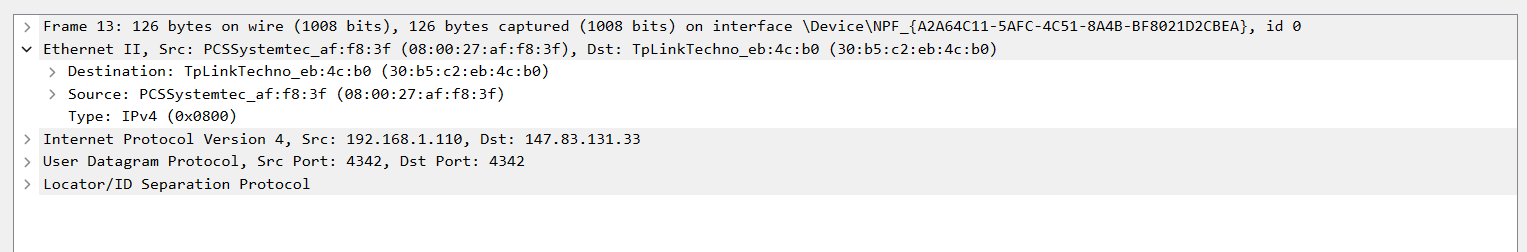
Then, we click on Ethernet II, this subtree contains details about the packet at the Ethernet level, including the source and destination MAC addresses and the type of internal protocol the Ethernet packet contains.
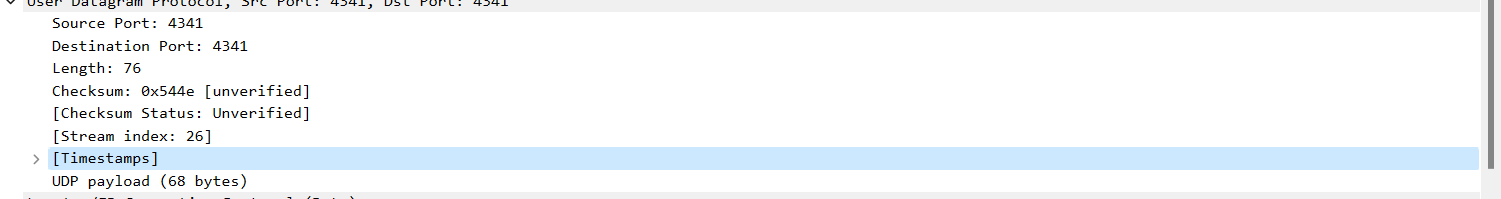
Next, we click on Internet Protocol Version 4, this section contains information about the source and destination IP addresses and the Internal Protocol (for example, TCP or UDP), which is carried inside the IP packet.
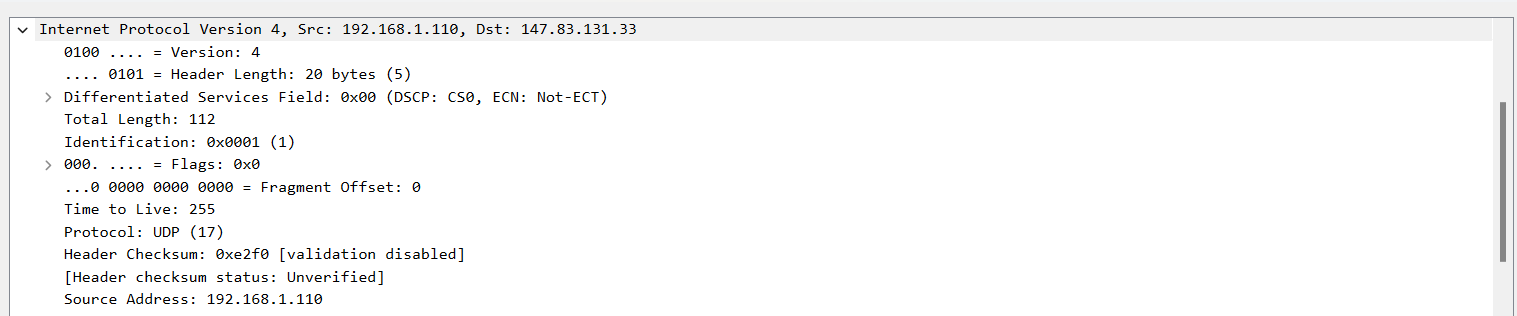
In the case of the file we are analyzing, the packet shows User Datagram Protocol, UDP, and this section contains information about UDP ports. It will show Transmission Control Protocol if the file that is being analyzed contains packets using a TCP connection.
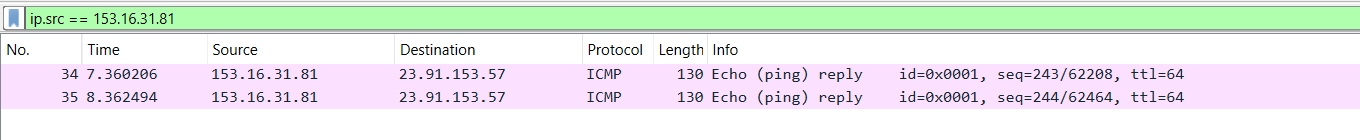
If we want to be more specific with our search, we can use the filter "ip.src" to look for an IP address as source or "ip.dst" to look for an IP address as destination.
ip.src == 153.16.31.81
ip.dst == 147.83.131.33

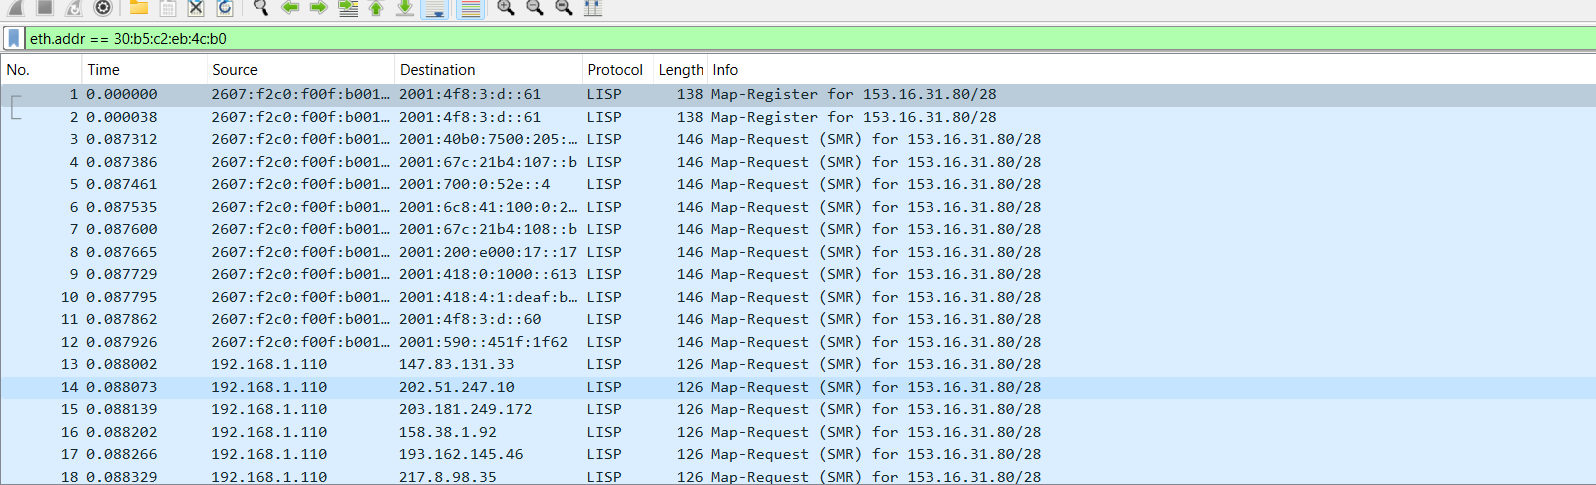
We can use a filter to look for a specific MAC address too.
eth.addr == 30:b5:c2:eb:4c:b0
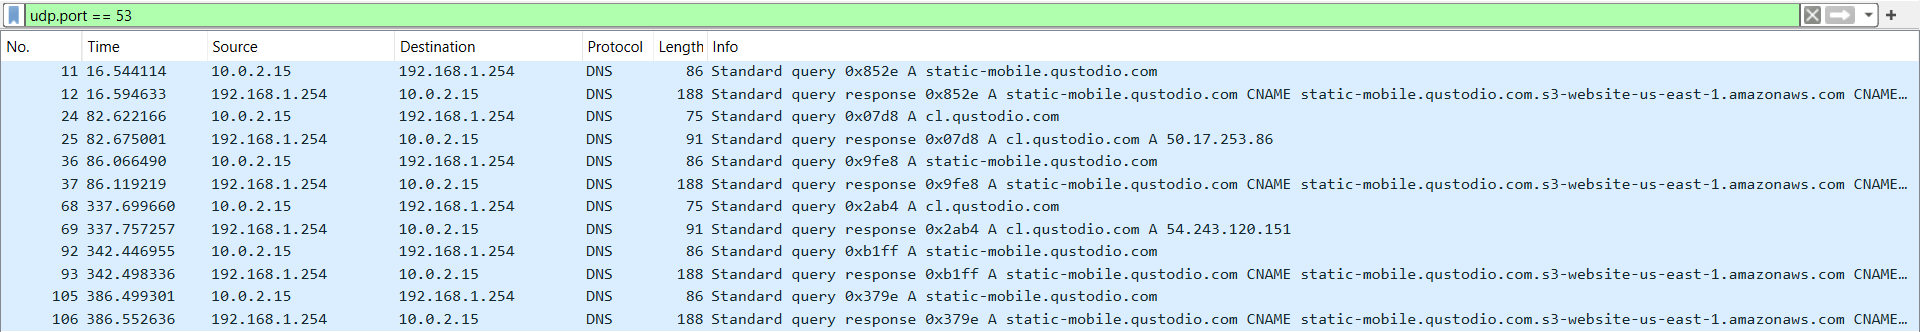
Also, we can use a filter to examine DNS traffic.
DNS is the system that stores information about domain names including IP addresses, mail servers, and other information.
I will open a different pcap file ("The open connection" file) for this task.
udp.port == 53
We can select any entry, scroll down, and double-click on Domain Name System (query).
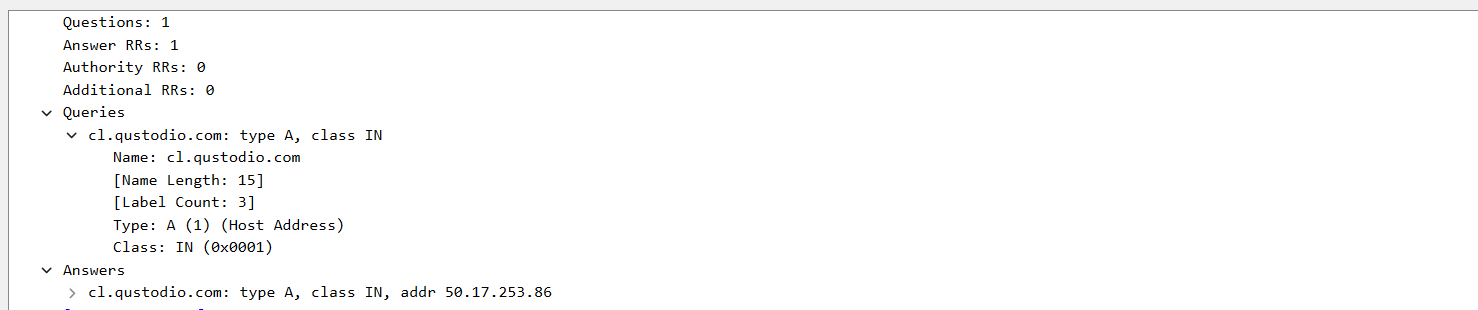
We click on "Queries" and in the case of the file I am analyzing, we can see the queried website (cl.qustodio.com).
If we click on the "Answers" section, we can see the address associated with the website (50.17.253.86).
Lastly, we will examine the traffic of a TCP port.
We use the filter:
tcp.port == 80
TCP port 80 is the default port that is associated with web traffic.
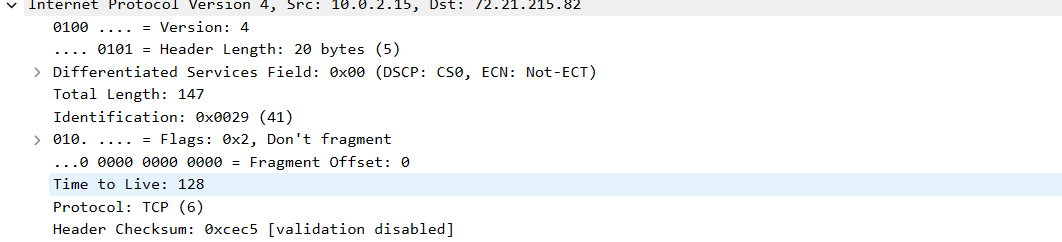
We select any entry. And double-click on "Internet Protocol Version 4". We scroll down and see the packet's Time To Live value, it indicates the maximum amount of time a packet can exist on the network before being discarded.
In this section, we can see the Header Length, the total size of the header section, in this case, 20 bytes.
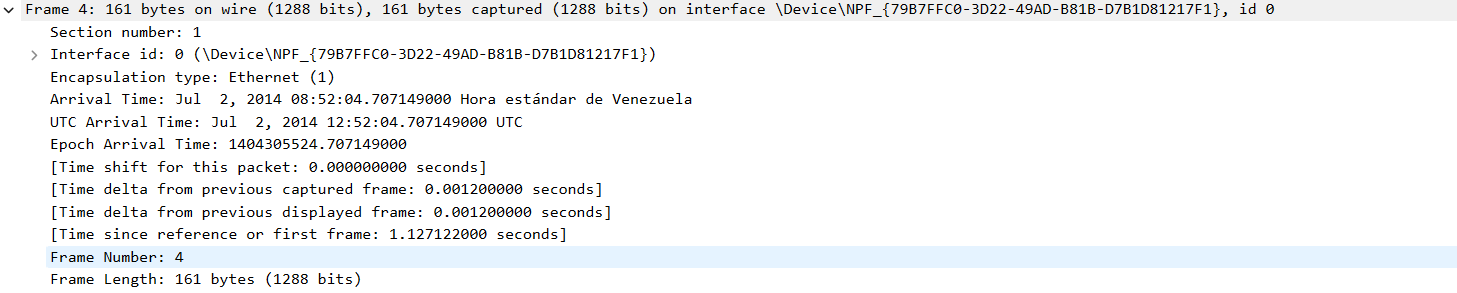
Clicking on the "Frame" section, we can see the Frame Length, which is the total size of the captured network packet.
Conclusion
So far, I have tried TCPdump and Wireshark. Both are amazing, useful, and widely used tools. However, the GUI that Wireshark offers makes analyzing network data more comfortable, in my opinion. If you want to try a packet sniffer with a GUI, that is widely used in the industry, I recommend Wireshark.
Thank you for taking the time to read this article.
If you have any recommendations about other packages, architectures, how to improve my code, my English, or anything; please leave a comment or contact me through Twitter, or LinkedIn.


